Live preview
Create Tally Charts from Your Data in Seconds
Turn your raw data into beautiful, easy-to-read tally charts.
What is a Tally Chart?
A tally chart is used to represent raw data in a table containing tally marks, showing the frequency of the data in an organized and structured form. It is commonly used in worksheets, spreadsheets, and data sheets for recording and analyzing information.
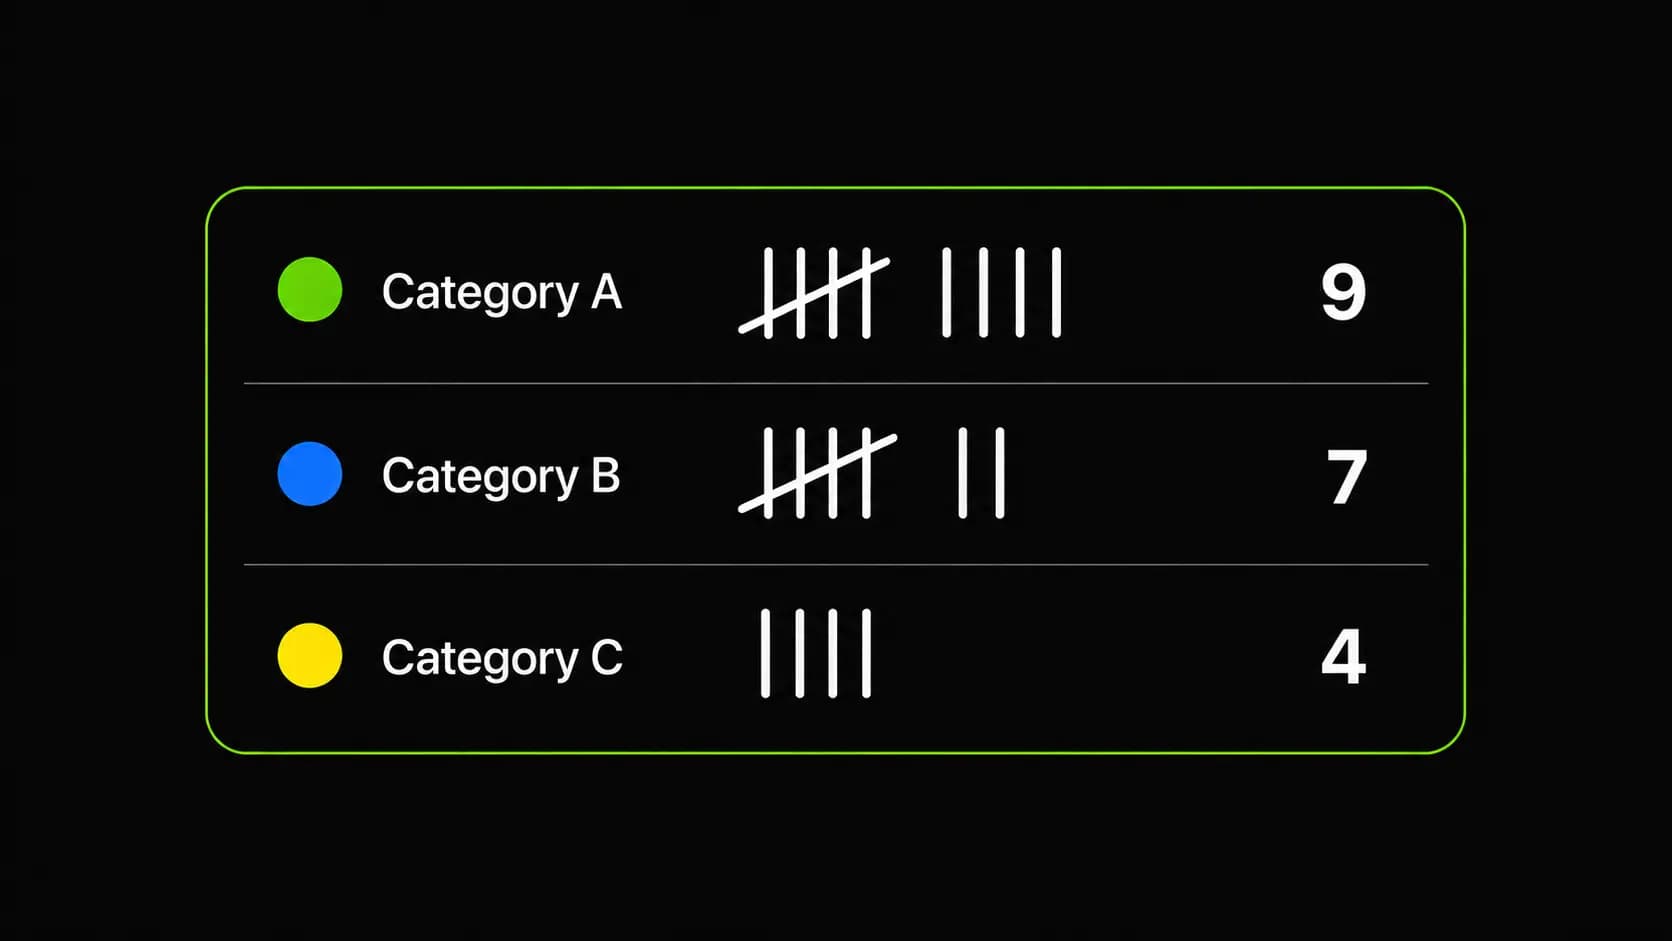
Create a Tally Chart with 4 easy steps
You only need to follow these four steps to make an organized and accurate tally chart online within seconds.
1Choose the Design preference
You can name your tally chart, choose the background colour and the border colour for the tally chart of your data.
2Enter Your Raw Data
Enter your raw data, figures & data points into the text area given, in order to track their frequency.
3Customize your Tally Chart
Here comes the part where you customize your tally chart settings according to your needs, like tally style format, chart heading, tally mark colors, background color, text color and tally chart format.
4Download in Your Preferred Format (PNG, JPEG, SVG, PDF)
Now that you've entered the raw data and adjusted the chart settings, click the generate button to create the tally chart , now you can easily download it. There are multiple format options like PNG, JPEG, SVG or PDF. You can also share your tally chart across multiple social media platforms directly.
Features of Tally chart Maker
Organize Data Instantly
Tallycounts offers instant data organization, turning raw data into an organized, structured tally chart format within just a few clicks with ultra accuracy.
Sort Your Data Your Way
You can sort your data according to your needs and select ascending, descending or original order for your tally chart.
Choose Your Tally chart Format
You can fully customize your tally chart settings like tally chart format, tally mark colors, tally mark style, text color and much more.
Data visualization made Easy
Your work deserves accurate and powerful data representation tools, and here comes Tallycounts which provides extensive and powerful data analysis and representation methods.
When to use tally charts vs when to avoid?
Tally charts are great in some situations and not so great in others. Here’s a simple breakdown.
Use a tally chart when:
- You are counting things live, as they happen, in front of you
- You have eight or fewer categories to track
- Your total count per category is expected to stay under fifty
- You need a fast, simple way to record data without a calculator or spreadsheet
- You are doing things like surveys, voting, polling, attendance, or quality checks
Avoid a tally chart when:
- You are dealing with hundreds or thousands of items to count
- Your data is continuous, like height, weight, or temperature (you would need to group it into ranges first)
- Events are happening too fast to mark them accurately
- Your data already exists in a spreadsheet or digital system
- You need to see trends over time or compare exact values (a bar chart or frequency table works better here)
Who Uses Tally Charts?
Teachers – Tracking Attendance & Grades
Researchers – Organizing Survey Data
Business Professionals – Tracking Sales & Feedback
Students – Completing Assignments & Projects
Why Choose Us?
The simple answer is fast, powerful and clear data visualization through the tally chart. By using Tallycounts, you can create and customize a tally chart online for free within seconds. Our online tally chart maker is highly responsive on all devices, with multiple download options for your tally chart.
- Speed with Accuracy
- Multiple formats
- 100% Free
- Auto-Saved Progress
- Advanced Customization
- Simple Yet Powerful
- Highly responsive
What Users Say About Tally Chart Generator
Hear from users who trust our tally chart maker.
“I pasted my whole survey list in and it counted every answer for me. That used to take me an hour with a pen.”
 Ayesha TariqMarket researcher
“We put the chart in our monthly report. I download the PNG and drop it straight into the slides.”
 Naveed SiddiquiSchool principal
“Needed a tally chart for a stats assignment. Had it made and downloaded in about two minutes.”
 Hamza IqbalUniversity student
“Good that I can set my own colours. Our client reports use a fixed palette and this matches it.”
 Bilal AhmedFreelance analyst
Frequently Asked Questions
What is the difference between Tally Chart vs Tally Counter tools?
A Tally Chart organizes raw data into a table using tally marks to show the frequency of each category making it useful for visualizing and analyzing data. A Tally Counter, on the other hand is a simple tool used to count things in real time, like reps, attendance or votes.
How do I create a tally chart using this generator?
Simply enter your list of data, customize your chart settings, generate your chart and download it in your preferred format. Read the guide above for detailed steps.
How can I customize the appearance of tally marks in my chart?
You can customize the appearance of your tally marks including tally mark color, tally mark style, background color, text color and font style to match your preference.
What sorting options are available for my tally chart?
You can sort your tally chart data in ascending, descending or original order based on your needs.
What format can I download my tally chart in?
You can download your tally chart in multiple formats including PNG, JPEG, SVG and PDF, making it easy to use in reports, presentations or documents.
Is the AI Tally Chart Generator free to use?
Yes, the Tally Chart Generator is 100% free to use with no hidden charges.
Who can benefit from the AI Tally Chart Generator?
Students, teachers, researchers, data analysts, business professionals, and anyone who needs to organize and visualize data can benefit from the AI Tally Chart Generator. It is ideal for creating tally charts for assignments, reports, presentations, and classroom board displays.
Why is the fifth tally mark drawn diagonally?
The diagonal slash groups four vertical lines into a bundle of five, so your brain can recognize the count instantly instead of counting each line one by one. This makes totaling faster just count in fives (5, 10, 15...) and add any leftover marks.